Open Source Toolkit for 3D Plant Modelling

Yesterday I came across an articel in Graphical Models (71), pp. 1-21. It is about PlantGL, an open-source graphic toolkit for the creation, simulation and analysis of 3D virtual plants. The software is based on three components: a geometric, an algorithmic and a GUI library with an interface to Phyton, which enables a modeller to develop scripts and procedures in Python. Furthermore, importers and exporters for data exchange with several modelling and visualization systems, such as AMAPmod/VPlants and Pov-Ray, exist. The approach combines several methods to represent plant structures at different scales, ranging from tissues to plant communities. One of the features are parametric envelopes for the representation of crown shapes, which sounds to be a very promising technique to control the shape of 3D plant models. Accurate representation of the crown shape will be important for representing plants in real world models (e.g. 3D city models) for visibility analysis.

According to the paper the librarys seem to be very powerful and several examples are presented reaching from 2D and 3D tissue models to branching systems and plant communities. Moreover, a quick overview over current plant modelling approaches is given including L-Studio/Vlab and GroGra based on L-systems, the AMAP system, and Xfrog and extensive references to related work are given. Thus I like to encourage everybody interested in plant and vegetation modelling to read the paper and look at the website of the Virtual Plant project team. The site shows several examples, links to research papers and software, and explains the methods apllied in the research.
Doug Eberhard (Autodesk) promoting CityGML

Last week, I had the chance to see Doug Eberhard, Senior Director of Autocad and head of the Digital Cities Initiative, speaking at the conference “The new dimension in GIS – 3D Analysis“, hosted by the British Columbia section of URISA. His focus were 3D city models and he promoted their future not only for visualization but also for analysis. According to him, the process and people behind need to catch up with the technology, i.e., processes and methods are needed for a collaborative workflow. All these issues are explored in the Digital Cities case studies with Seoul and Salzburg being the first two.

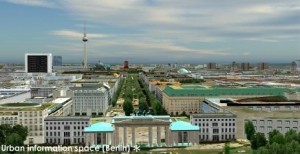
Interestingly, Mr. Eberhard showed lots of examples from LandXplorer (though without mentioning the name of the product) and gave a lot of credits “to the Germans”. Furthermore, he highlighted that CityGML and its interface ADE allow to incorporate extensions for analyses and that has huge potential from his point of view.

LandXplorer screenshort of Berlin (source: http://www.3dgeo.de)

Apparently, Autocad is promoting LandXplorer and CityGML now, which I find very encouraging. You can download an abstract of Mr. Eberhard’s talk at http://www.urisabc.org/assets/events/2009/3D/bios_abstracts/digitalcities.htm and if you like to see another presentation by Doug Eberhard, he will be at AGIT (Salzburg) as well as Geoweb (Vancouver).

First Open Source GIS UK Conference

Date: June 22, 2009

Location: University of Nottingham, UK

Website: www.opensourcegis.org.uk

GEOIDE Annual Scientific Conference

Date: May 27-29, 2009

Venue: Vancouver Marriott Pi­­­nnacle Downtown Hotel

Location: Vancouver, BC

Website: www.geoide.ulaval.ca/conf09/main.asp

GoogleEarth 5.0: 20000 Miles Under The Sea

The new version of GoogleEarth, which can be downloaded now, has been extended by the underwater landscape of the Earth – which is two third of the Earth’s surface… Furthermore, the function for setting up your own tours has been improved and the time-travel function has become standard. Now, it will be really interesting to use GoogleEarth to show landscape development over time, historic and into the future. Oh, and finally, they added the Mars. For a more detailed summary of the new functions in German, see the Der Google Produkt-Kompass: Reise unter die Meeresoberfläche mit Google Earth 5.0 or Youtube (English):